


Unite Data,
Activate Decision
SaaS platform for better performance, increased ROI, and long-term profitability of renewable assets throughout their lifecycle.
20,000 sites rely on SynaptiQ for performance optimisation

.avif)


Elliot Morgan
Asset Manager
Sunrock
Mirko Stjepic
O&M Manager
Romande Energie

Jef Hoogsteyns
B2B Service Manager
Insaver-Luminus
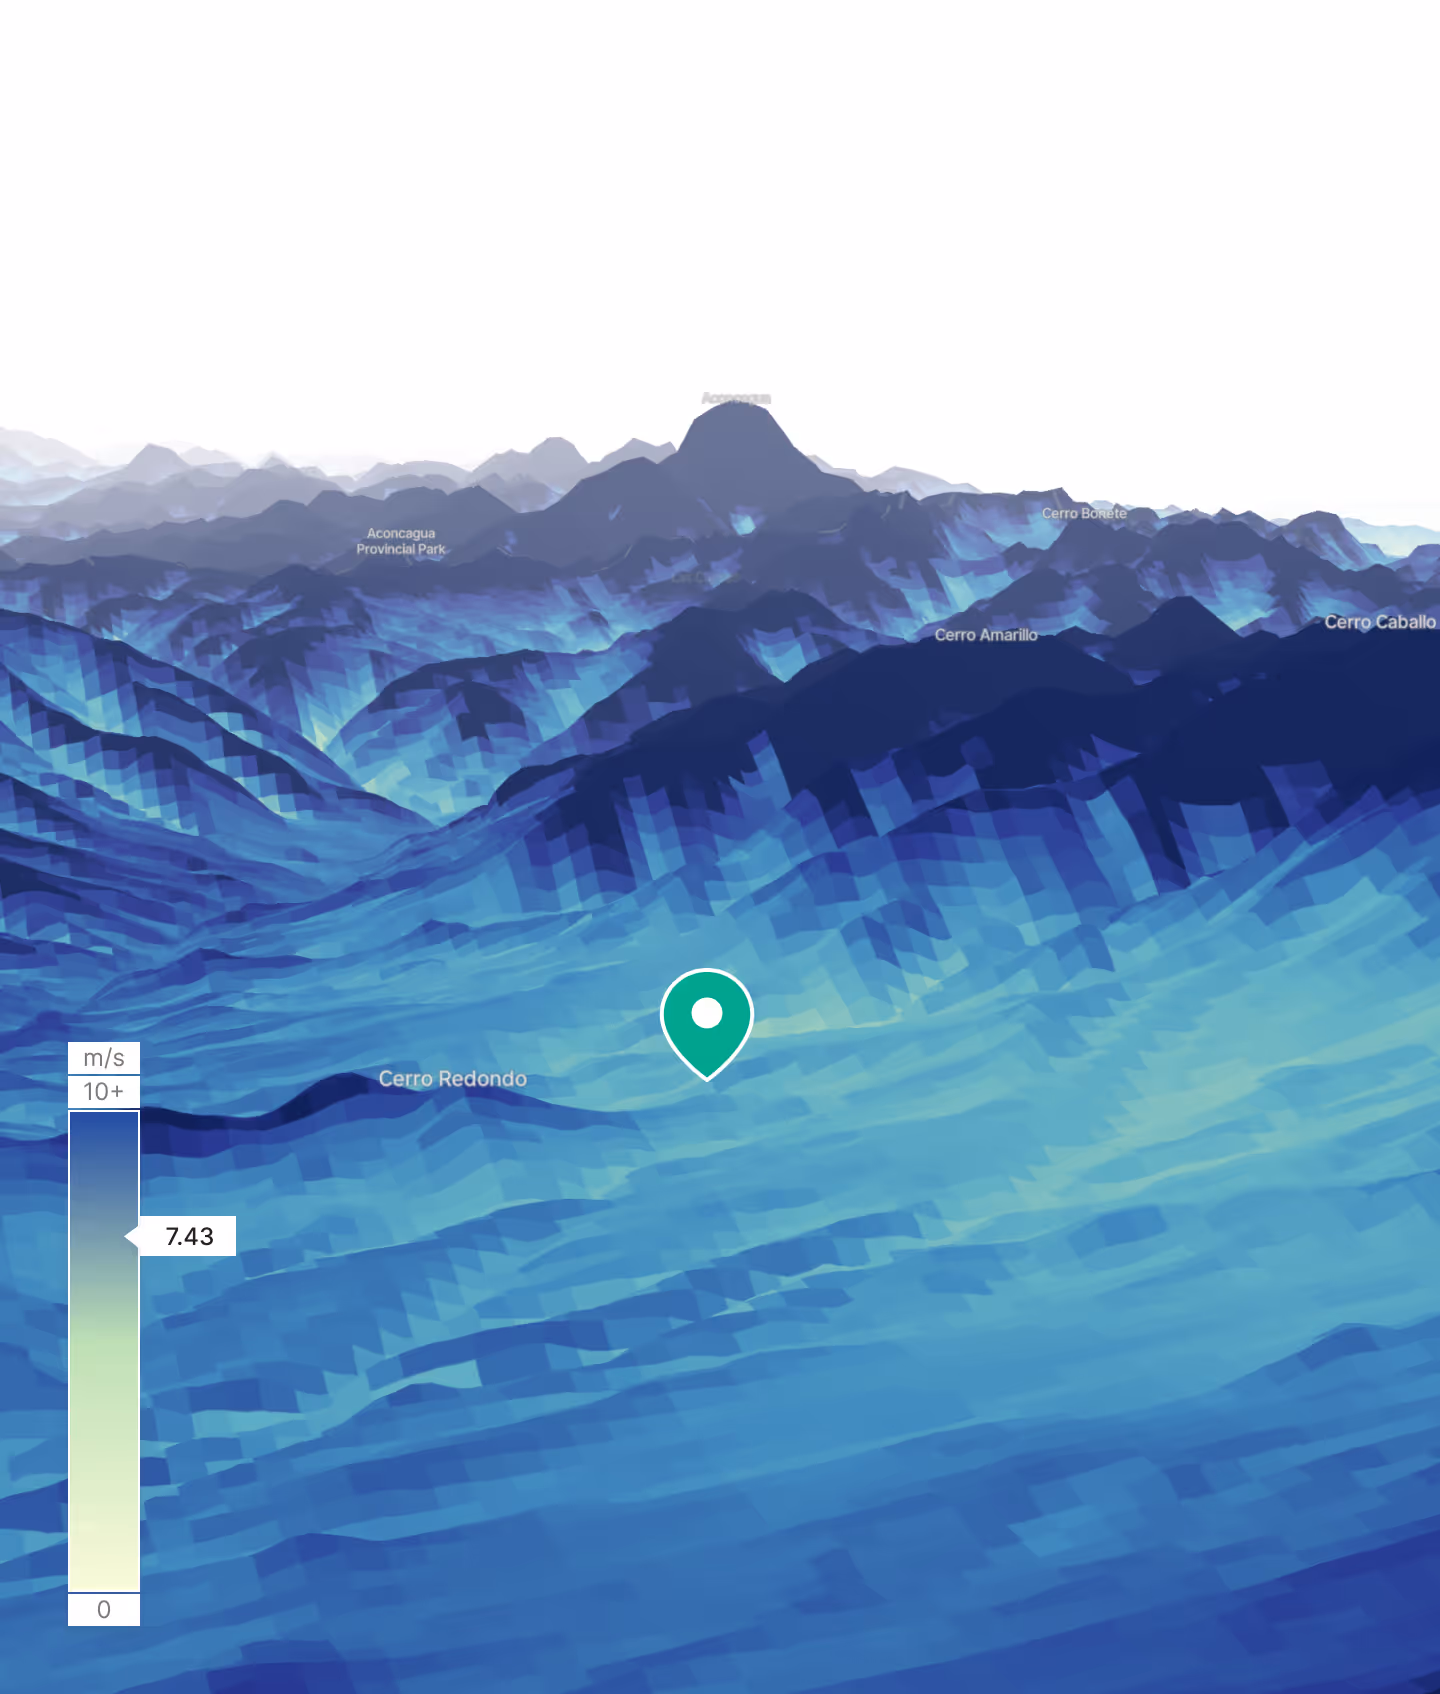
Leverage the unmatched accuracy of our Physics Based Digital Twin, driven by real-time modeling satellite data and enriched with bankable resource data.
Experience hardware agnostic compatibility and capture all interactions, from your field services to financials across solar, wind and storage systems.


Unleash the Power of Built-in Analytics. Discover the out-of-the-box advanced performance KPI's and best-of-class analytics for performance optimization. Gain valuable insights on asset health and take control of your success.
Gain control with fully customizable dashboards and automated reporting, tailored to the specific needs of you and your team.

SynaptiQ helps teams to develop, monitor and optimise renewable assets.

Develop projects, grow fast
Obtain high-resolution wind data and bankable solar irradiation data to assess long-term yield, enhance ROI, and evaluate plant performance of future renewable assets.

Monitor alarms, close gaps
Reduce operational effort with reliable site / portfolio monitoring, smart alarms, and simple reporting enabled by your assets' digital twin.

Analyse performance, increase ROI
Automate your plant diagnostics by recognizing performance losses, allowing you to close the energy gap between expected and measured energy.
The right application for every project phase.
Empowering all in the renewable energy landscape - from developers and operators to asset owners, O&M managers, and data specialists
Solar Irradiation Data
Get unlimited access to Typical Meteorological Year (TMY) & Historical Time Series data to reduce your yield uncertainty and increase project value

Asset Operations
Optimise the operations, performance analysis & reporting of your solar, wind and storage portfolio with comprehensive functionality beyond monitoring
One platform to empower all: Analyse, address, and optimise plant performance with ease using cutting-edge predictive analytics


Trusted by 200+ operators & managers
Get a glimpse of our accomplishments, reflecting our dedication, proficiency, and the tangible impact we have made in asset performance management.
Frequently Asked Questions
Discover valuable information about our services, products, and more.
A physics-based digital twin is a cutting-edge virtual replica that models the physical behavior of an object or system in real-time, offering a dynamic and accurate representation. Unlike a conventional digital twin, it leverages physics simulations to provide more precise insights, allowing for enhanced predictive capabilities and in-depth analysis of complex interactions.
SynaptiQ uses an advanced information model for near-real-time indicators, accessible through dashboards. Visualize data, interpret performance, detect losses early with analysis. Smart alarms and task management ensure timely issue identification and resolution, maximizing asset efficiency.
SynaptiQ's Analytics application automatically identifies and quantifies performance issues, providing actionable recommendations for maximum impact on yield. With industry-leading accuracy, our physics-based modeling approach offers detailed loss split-up and root cause analysis.
The SynaptiQ platform supports solar, wind, and storage technologies for monitoring and performance optimization of your plant and portfolio. It provides comprehensive capabilities to collect, analyze, and visualize data from these renewable energy sources, allowing you to effectively monitor the performance of your assets.
In SynaptiQ, we prioritize the onboarding process for your assets, ensuring efficiency and simplicity. With our advanced technology, we offer hardware agnostic and self-deployment options. Our platform supports a wide range of brands, including 79 brands of inverters and 34 brands of data loggers, while accommodating multiple communication protocols.
Related resources
Explore our knowledge hub for insightful articles, guides, and solutions