By Nicolas Meerts, Arthur Ostyn, Grégory Ignace
Have you ever considered that mixed assets into portfolios can increase their aggregate value by 2.0%?
As renewable energy portfolios continue to scale in both size and complexity, investors, lenders, and developers are increasingly moving beyond single-asset evaluations toward portfolio-level risk assessment.
In this context, the way uncertainty is treated in long-term energy yield assessments becomes critically important.
Traditional approaches often assess wind, solar and BESS assets individually and then aggregate their P90 values at portfolio level. While conservative, this method implicitly assumes perfect correlation between projects, an assumption that rarely reflects physical reality.
In practice, renewable assets are influenced by different climatic conditions, technologies, operational contexts, and modelling approaches. Geographic diversification, technology mix, and independent methodologies can significantly reduce the overall uncertainty of a portfolio.
This phenomenon, which we refer to as the Portfolio Effect, can materially improve the aggregate P90 of renewable portfolios and therefore strengthen project bankability, financing conditions, and investment resilience.
In this article, we explore how correlation between uncertainty components impacts portfolio-level energy yield assessments, why diversification matters, and how both simulated and real-world portfolios can benefit from a more realistic treatment of uncertainty.

Why summing P90s is wrong to calculate the long-term energy yield assessment of a portfolio of renewable energy assets
Most uncertainties in a long-term energy yield assessment are assumed to follow analytical distributions and combined by root-sum-squaring. However, because assessments are produced at single-asset level, portfolio P90s are often simply summed, implying perfect correlation between assets. This assumption is conservative and results in a poor approximation of physical reality.
Diversification is key
In practice, uncertainties are decorrelated due to three main diversification routes:
- Geographically spreading assets reduces exposure to correlated interannual climate variability;
- Technological: combining PV and wind assets removes most correlating uncertainty factors. Varying turbine types limits common-mode errors;
- Methodological: making use of independent measurement campaigns, different modelling approaches, different consultants;
To quantify the effect correlation between uncertainty components on the combined uncertainty on the energy yield estimate of a portfolio containing two assets, the following equation (Eq. 1) is used, where:
- μ_x: mean of the distribution (i.e. our P50)
- σ_x: spread of the distribution (the uncertainty on P50)
- ρ_xy: correlation between two uncertainties

From two-asset theory to N-asset portfolios
This generalises to a portfolio of n assets with a P50 of w_x, where each uncertainty component is combined. The uncertainty of the portfolio is assessed as usual by root-sum-squaring the uncertainty components σ_p assuming independence between components.

Quantifying decorrelation
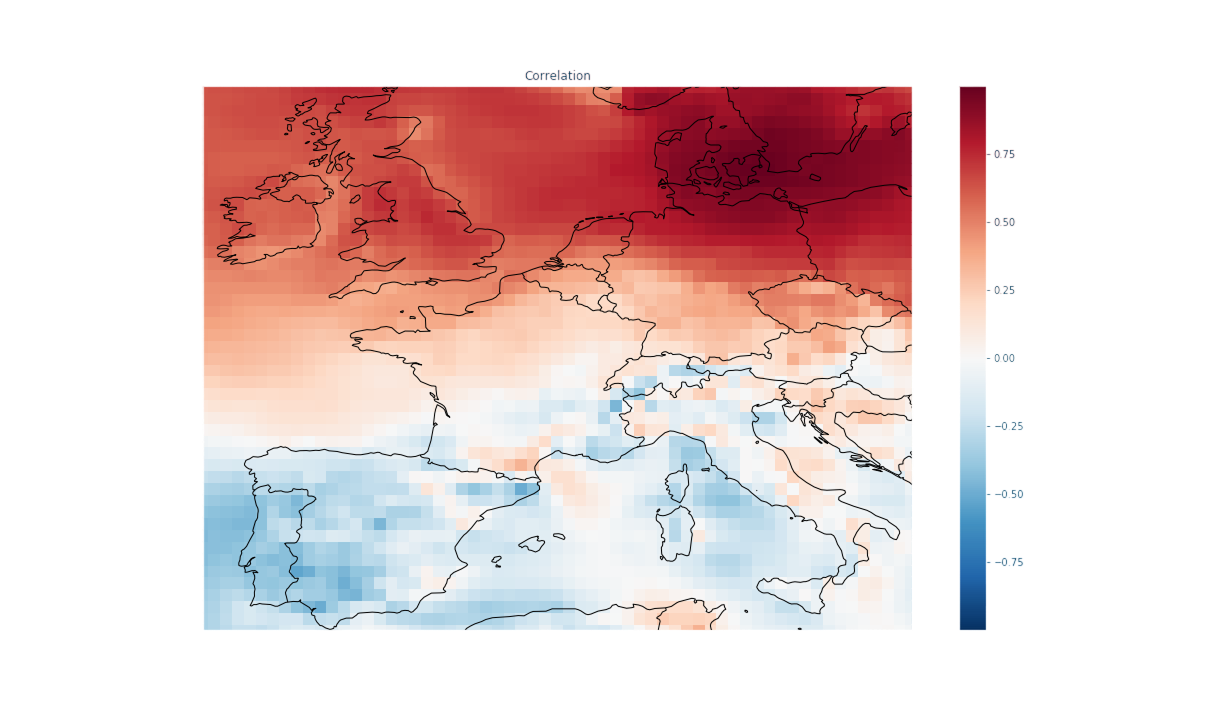
The level of decorrelation is judgement-dependent, except for two tractable cases: climate variability and technology-driven decorrelation. The former can be estimated from reanalysis data: Fig. 2 shows the correlation of inter-annual wind speed variability between Copenhagen and ERA5 grid points across Western Europe, illustrating the strong decorrelation from the Iberian climate and the resulting potential for portfolio P90 improvement. The latter justifies assuming near-full decorrelation of most uncertainty components when combining fundamentally different technologies, such as wind and solar.
Simulated and real-word portfolio gains
To evaluate the potential for the portfolio-benefit from combining multiple technologies, and geographically distant assets, we simulated various fictitious cases for portfolios of two assets with decreasing levels of similarity:
In a real-world example, applying the same methodology as part of a due diligence on a portfolio of 350 MW combining wind and solar assets across France yielded a gain of 3.5%, with most of the contribution arising from the PV assets which representing less than 10% of the portfolio AEP.

Conclusion: Rethinking Portfolio P90 Assessments
Summing single-asset P90s is a structural conservative bias. Accounting for actual inter-asset correlations, even within apparently homogeneous portfolios, consistently unlocks P90 improvements of 2-4%, with larger gains where wind and solar are combined.
The key remaining challenge is the robust, defensible estimation of correlation coefficients. As portfolio-level yield assessment becomes more common in project financing, standardised approaches to this estimation will therefore be essential to the industry.